Product Intelligence for Mobile Apps: The Two Lenses
Product intelligence for mobile apps splits into two lenses that most tools do not distinguish clearly. First-party product analytics tools like Amplitude, Mixpanel, and Contentsquare work from your own users, your own analytics, your own customer conversations. Outside-in product intelligence works from the actual product artefacts competitors shipped in the market. This article covers the second lens: what outside-in evidence adds to product planning decisions, the specific signals it produces that first-party analytics cannot, and how a mobile product manager can build a monthly product intelligence review into their planning cadence.
Mobile product managers doing serious product planning work regularly hit the same wall. Their first-party analytics stack (Amplitude, Mixpanel, Firebase, or similar) tells them everything about how their own users behave inside their own app. Their customer research tools (Dovetail, user interviews, support tickets) tell them what their own users want. Their industry reports from Sensor Tower, Adjust, or data.ai tell them about aggregate market patterns. What none of these tell them is what competitors actually shipped in the market this week, which specific SDKs those competitors added or dropped, whether a particular technology category is gaining shipping traction across the market or just generating industry conversation, and whether a competitor removed a feature that seemed important. Those questions need a different data source: the shipped product artefacts themselves.
This article covers outside-in product intelligence for mobile apps specifically. Product intelligence as a discipline has two distinct lenses that most tools do not distinguish clearly, and the outside-in lens is the one that fills the gap first-party analytics and industry aggregate reports leave. The article is aimed at product managers, product marketing managers, mobile team leads, and agency practice leads making product planning decisions who need evidence beyond their own analytics stack. It builds toward a specific outcome: a monthly product intelligence review a PM can run to feed product planning decisions with signals that first-party tools cannot produce.
For the wider definition of mobile app intelligence as a discipline, see What is Mobile App Intelligence. This article covers the specific product-planning application of the discipline.
How Product Intelligence Splits Into Two Lenses
Product intelligence is the discipline of gathering evidence about mobile products, both yours and competitors, to inform product planning decisions. It sits as a discipline with two distinct lenses. Naming them separately matters because tools in each lens answer different questions, and the wrong lens for a specific question produces incomplete answers regardless of how comprehensive the tool is within its own lens.
The first lens is user and industry analysis. Tools in this lens work either from your first-party data (product analytics on your own users, customer research on your own conversations, planning platforms managing your own roadmap) or from aggregate industry data (panel data, download estimates, market-level signals aggregated across many apps). Both categories are useful and cover a lot of ground for product planning. Both share a limitation: their data sources do not include the shipped product artefacts of competitor apps in the market. That is a genuine constraint for specific product decisions.
The second lens is product analysis, meaning reading the actual product artefacts competitors shipped. Different data source, different questions answerable. This is the lens where outside-in evidence lives. The specific tools operating in each lens are covered in the next section.
| Question | User/industry lens | Product analysis lens | Which tool category answers this |
|---|---|---|---|
| How are our users behaving in our app | Answered well | Not addressed | First-party product analytics |
| What features drive engagement in our category | Partially answered from aggregates | Answered directly from shipped apps | Both lenses together |
| Which SDKs competitors ship in their apps | Not addressed | Answered directly | Mobile app intelligence |
| What OS versions competitors support | Not addressed | Answered directly | Mobile app intelligence |
| How does release cadence compare across the category | Partially answered from store data | Answered from continuous monitoring | Mobile app intelligence |
| Which features have competitors removed | Not addressed | Answered from release notes and version diffs | Outside-in evidence specifically |
| What compliance patterns exist across our category | Not addressed | Answered from store surface | Outside-in evidence specifically |
| How is a technology gaining shipping traction (AR, subscriptions, etc) | Partially answered from industry commentary | Answered from actual shipping rates | Outside-in evidence specifically |
The table shows the specific point clearly: the product analysis lens answers questions the user and industry lens genuinely cannot, because the data source is different. The reverse is also true. Together they cover a wider range of product planning decisions than either alone.
Product Intelligence Tools, by Lens
Product intelligence tools sit under one lens or the other, and treating them accordingly avoids the common error of expecting a first-party analytics tool to answer competitor-artefact questions or expecting an outside-in evidence tool to replace behavioural analytics on your own users.
Tools operating on the user and industry lens work from data you already own or aggregate market data your organisation licences. First-party product analytics platforms including Amplitude, Mixpanel, and Contentsquare cover in-app user behaviour. Customer research platforms including Dovetail and Vypr cover user conversations and structured research. Planning platforms including ProductPlan, Productboard, and Aha cover the roadmap workflow itself. Aggregate market data providers including Sensor Tower, data.ai, Adjust, and SimilarWeb cover category-level signals from panel data and download estimates. Each is genuinely useful within its lens.
Tools operating on the product analysis lens work from the actual product artefacts competitors shipped in the market. SDK-focused tools include 42matters and MightySignal (part of Airnow following the 2021 acquisition), both producing SDK-level intelligence for mobile apps. Broader outside-in evidence tools include Appnalysis, which produces evidence across store-surface signals plus package-level analysis including SDK inventory, permission scope, compliance patterns, and release cadence. For a wider tools comparison across mobile app intelligence categories, Market Intelligence Tools for Mobile Apps covers the full landscape.
Choosing tools by lens rather than by feature list simplifies the evaluation. If the product decision needs evidence about your own users' behaviour, evaluate first-party analytics tools. If the product decision needs evidence about what competitors shipped, evaluate outside-in evidence tools. Most mature product intelligence functions use both categories together because their product decisions touch both types of evidence.
Four Product-Level Signals Competitors Leave Behind
Product-level signals from competitor apps are the specific evidence outside-in analysis produces that first-party tools cannot. Most competitor benchmarking work covers the user and industry metrics only because those are what standard tools expose. The product analysis lens exposes a different set of signals that operate at the artefact level and inform product decisions rather than marketing decisions. Both are legitimate benchmarking work; most content covers the first set and leaves the second set to inference.
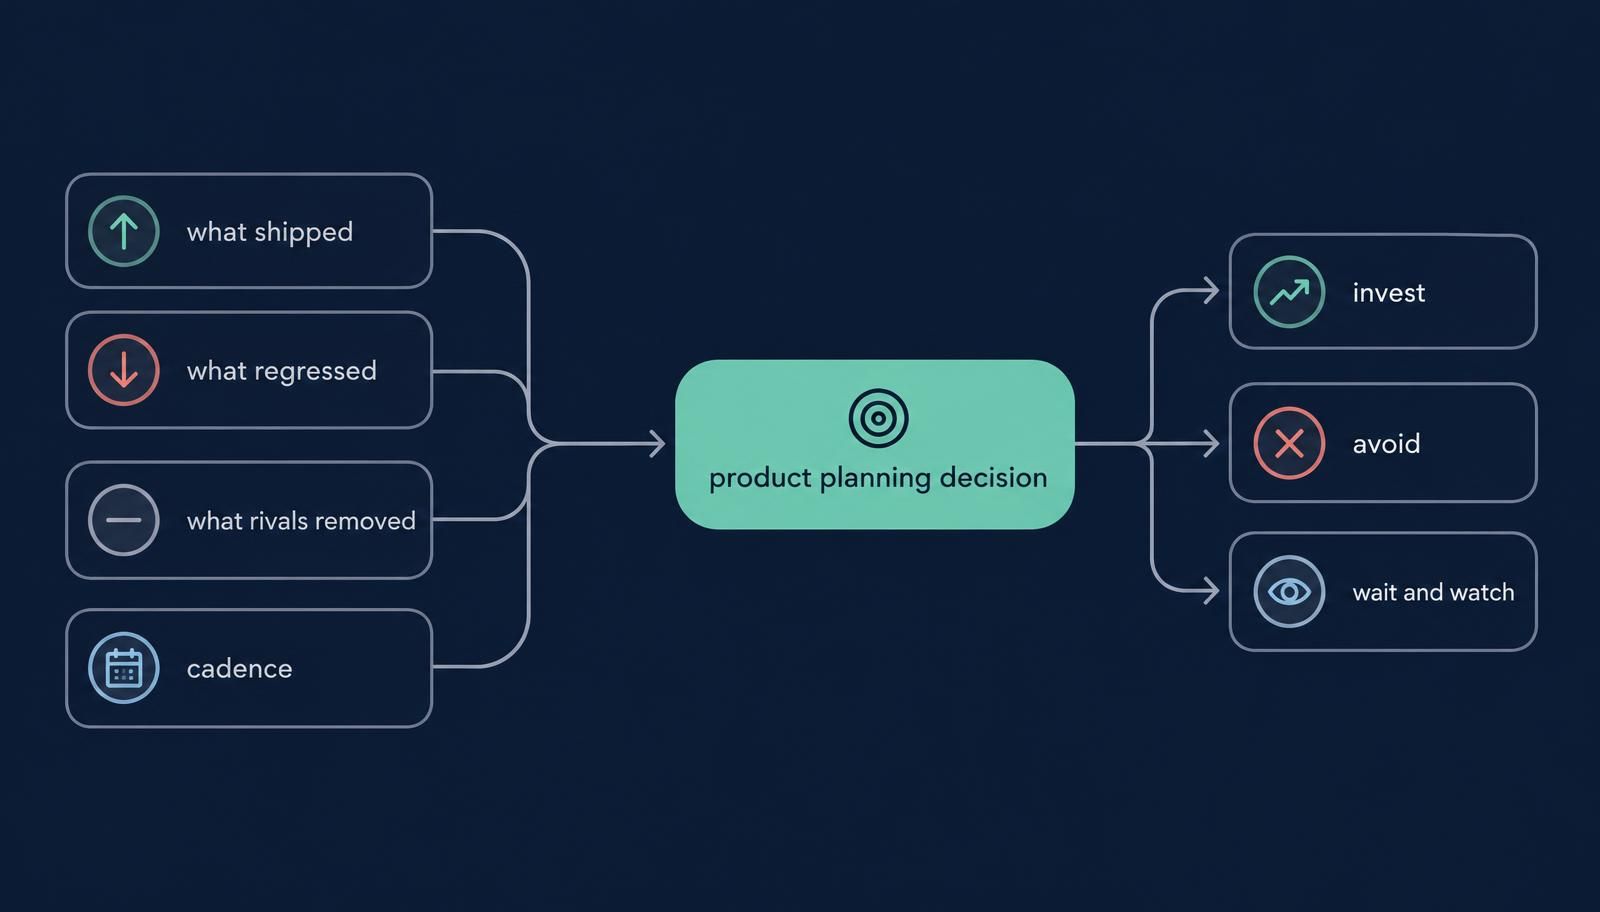
The product analysis lens produces four specific signal types that inform product planning inputs a first-party analytics stack cannot produce. Each answers a different product question.
What shipped. The most direct signal. Competitors release new features in updates, and reading the release notes plus the version-over-version changes surfaces what actually reached users versus what was announced or speculated. For product planning, this tells you what patterns competitors are validating (or have committed budget to) and where the category is moving. A category-wide pattern of shipping specific capability tells you that capability is becoming table stakes. A single competitor shipping something novel tells you they are running an experiment worth watching.
What regressed. A quieter signal that most competitor benchmarking misses. Features that got worse or capability that reduced in a competitor's update. A capability that used to work well and now works less well. A feature that used to have depth and now has surface treatment. Regressions tell you something about strategy shifts (the competitor de-emphasised this), engineering trade-offs (they broke it and are prioritising other work), or user feedback (users pushed back on it). Product planning signal because it flags patterns competitors are backing away from, which sometimes tells you more about the category than what they are pushing toward.
What rivals removed. Different from regressed because removal is a deliberate decision, not a quality change. Features completely removed from a competitor's product tell you which experiments failed for them, which segments they abandoned, or which regulatory and platform pressure they responded to. A competitor removing subscription tiers tells you something about their revenue experiments. A competitor removing a specific integration tells you something about vendor relationships or user adoption. A competitor removing a whole product surface tells you they made a strategic call. Product planning signal because removals are strategic decisions competitors rarely publicise.
Cadence. Not what shipped but how often. Release cadence patterns tell you about a competitor's engineering capacity, their approach to shipping (continuous versus batch), their responsiveness to platform changes, and their organisational health. A competitor that goes from weekly releases to monthly releases is signalling something. A competitor that maintains steady cadence through platform upheavals is signalling engineering discipline. Product planning signal because cadence is a proxy for how quickly competitors can respond to market moves your team makes.
Industry reports from Sensor Tower, data.ai, Adjust, AppsFlyer are valuable but backward-looking. Q2 data typically appears in October reports. Outside-in evidence produces current-state signal on these four signal types, complementary to the industry reports rather than replacing them. A product manager who reads the quarterly industry reports for aggregate market context and runs a monthly outside-in review for current-state signals has both time horizons covered.
For a deeper treatment of benchmarking in the capability-planning context specifically, see Mobile App Metrics for Training and Capability Planning, which covers product benchmarking as a discipline for assessing a team's capability rather than for feeding product planning inputs.
Mobile App Tech Stack as Product Intelligence
The tech stack a competitor ships in their mobile app is one of the strongest product intelligence signals available and one of the least used in typical product planning conversations. Which SDKs a competitor bundles, which frameworks they committed to, which analytics and monetisation infrastructure they chose, which third-party services they depend on, all sit in the shipped app package as evidence readable through outside-in analysis.
For product planning, mobile app tech stack signals answer several specific questions. Which integrations are becoming table stakes in the category (if every competitor in your space now ships the same subscription infrastructure, that is a signal about user expectations). Which SDKs are being deprecated across the category (if competitors are dropping a specific vendor SDK, worth understanding why before committing to it). Which frameworks are gaining or losing market share among peers (framework choices predict future ecosystem support, community activity, and hiring markets). Which ad tech integrations competitors are running (relevant if your monetisation model touches advertising). Which analytics stack competitors chose (predicts what they can measure and therefore what they can optimise for).
The SDK-focused tools named earlier (42matters and MightySignal) specialise in this data. Appnalysis produces SDK inventory as part of a broader outside-in evidence surface that includes store-surface signals, release cadence, permission scope, and compliance patterns. Different depth in different places. Product teams evaluating tools for tech stack intelligence should compare on SDK catalogue coverage, refresh cadence, and whether the tool supports the specific product questions the team is trying to answer rather than just producing SDK lists.
Android device fragmentation is a specific tech stack dimension worth naming because it lives at the intersection of tech stack choices and market coverage decisions. Which Android devices a competitor's app supports, which minimum Android version they set, which specific device features they exclude or include, all sit in the shipped app manifest as declared evidence. Product decisions about which devices to support in your own app benefit from understanding what competitors have chosen to support and where they have chosen to draw lines. The evidence is publicly available on the app stores; it just needs to be read systematically rather than app-by-app.
Technology Adoption as Product Intelligence
Technology adoption in a market has a specific shape that outside-in evidence reveals and industry commentary tends to obscure. A technology category can generate substantial industry conversation without generating proportional shipping traction, and product decisions made on the industry conversation alone tend to over-invest in patterns that are being talked about more than shipped. Outside-in evidence of what competitors actually shipped is the disambiguation signal.
Augmented reality in mobile apps is the sharp worked example. Substantial industry conversation about AR in mobile has run for years, with regular predictions of AR becoming a mainstream mobile capability. The actual shipping rate has been considerably lower than the conversation would suggest. Meta is the most visible market example of the pattern: the company rebranded around Reality Labs, committed multi-year budget to AR and VR product bets, and positioned AR as central to its future roadmap. Recent public signals point to a slowdown: Reality Labs losses continue, some AR-first product bets have been quietly rescoped, and Meta's actual shipped mobile apps do not carry as much AR-first product as the strategy narrative would suggest. Even the company that made AR its whole identity has been shipping less AR-first product than its positioning implied. Some categories have adopted AR meaningfully (retail try-on, furniture placement, some gaming); most categories have not. A product manager reading only the industry conversation about AR would conclude the technology is more central to mobile apps than the actual shipping evidence supports. A product manager who runs a category-level AR SDK adoption check on their competitors gets a genuinely different signal, and their AR investment decision reflects the actual shipping reality rather than the aspirational conversation.
The AR pattern generalises. Any technology category with active industry conversation but uncertain shipping traction has this shape: hype versus shipping asymmetry. Outside-in evidence resolves the asymmetry because it reads what actually shipped, not what was written or spoken about. Product managers running technology adoption checks on categories they are considering investing in benefit from this disambiguation because product commitment happens at the artefact level, not the conversation level.
Mobile app trends discussion in industry publications tends to lag actual shipping trends by a quarter or more because industry writers report on what has become visible enough to write about. Outside-in evidence produces earlier signal because it reads the shipping product directly, without waiting for pattern recognition and article commissioning. That earlier signal is genuinely useful for product managers making investment decisions about where the category is heading, with the honest caveat that early signals also carry more noise. A discipline for interpreting early signals (looking for pattern rather than single instances, cross-checking against category adjacent evidence, holding decisions until pattern strengthens) is worth building alongside the tooling that produces the signals.
Device Coverage and OS Coverage as Product Decisions
Device coverage and OS coverage are two product intelligence dimensions that operate specifically at the artefact level. Both need reading directly from the shipped app package because neither shows up in first-party analytics of your own users or in aggregate industry reports about the market.
Device coverage across Android and iOS fragmentation is a genuinely fragmented picture. Android device diversity is well documented but the specific patterns matter for product decisions: which OEMs competitors are treating as first-class targets, which screen sizes they optimised for, which device features they require versus recommend, which markets their device support strategy prioritises. iOS coverage is less fragmented but has its own patterns: which iPhone models competitors set as minimum, whether they treat iPad as first-class or afterthought, how they handle newer platform capabilities.
Apple's September 2026 announcement of iPhone Duo, its first foldable iPhone (7.6-inch inner display, 5.4-inch outer display, shipping late October 2026), is a live example worth naming. Some commentators are already framing iPhone Duo as an iPad mini replacement because the inner display sits close to iPad mini territory at the folded-open size. Others are treating it as a distinct new form factor. Product decisions across the mobile app market are being made right now on the back of this launch: which apps ship Duo-optimised builds and support the new posable orientations (Split View multitasking, hands-free FaceTime, StandBy on the outer display), which categories reframe their layouts to use the second display when the device is folded closed, which content-consumption apps treat the inner display as a tablet target, and which productivity apps rework their UX for the new form factor entirely. This is exactly the kind of product intelligence signal that first-party analytics cannot produce because your first-party analytics only sees the users who successfully installed your app, not the users your device or OS coverage choices excluded, and it cannot tell you which competitors moved first on Duo support.
Tech stack signals from section 4 predict Duo readiness before a Duo-optimised build ships. Apps that were already designed for both iPhone and iPad using Size Classes (Regular/Compact width handling), NavigationSplitView or UISplitViewController with column-style behaviour, safeAreaLayoutGuide and layoutMarginsGuide binding, and compositional layouts with fractional sizing map cleanly to iPhone Duo's different states because the same size class framework that makes them adapt between iPhone portrait and iPad landscape also handles the fold-open transition. Apps that hardcoded device dimensions, checked for specific device models, or built rigid pixel-perfect layouts have technology choices that close down the flexibility the new form factor needs and will require substantial rework to support Duo well. Reading a competitor's tech stack for evidence of adaptive layout frameworks, Size Class awareness, and modern navigation container adoption tells you their Duo readiness before you can measure their Duo-specific shipping behaviour. This is the specific bridge Appnalysis is built for: deep app knowledge (what SDKs and frameworks each competitor ships), tech understanding (what those choices mean for adaptive capability), and product implications (which competitors are structurally positioned to move fast on new form factors and which will be slow). Product decisions about your own Duo support strategy benefit from knowing not just what competitors have shipped but what they are structurally positioned to ship next. Product decisions about your own device support strategy benefit from evidence about what competitors chose, not just aggregate market share data about which devices users own.
OS version coverage is a related but distinct dimension. Which minimum Android version competitors set, which minimum iOS version they require, whether they are aggressive about deprecating old versions or conservative, how they handle new OS features that only work on recent versions. OS version choices reflect trade-offs between market reach (more OS versions supported means more users can install) and engineering cost (each OS version supported adds testing surface, compatibility code, and potential technical debt). Reading competitor OS version choices reveals how they balance this trade-off, which informs how your team should think about your own balance.
Both dimensions live in the shipped app package as declared evidence. Both are readable systematically through outside-in analysis. Both feed product engineering and product management decisions that first-party analytics cannot inform because your first-party analytics only sees the users who successfully installed your app, not the users your device or OS coverage choices excluded.
Feature Prioritization From Outside-In Evidence
Feature prioritization is a product management discipline with dozens of frameworks (RICE, MoSCoW, Kano, weighted scoring, opportunity scoring, many others). Each framework works well when fed with good inputs and produces confident-looking output when fed with poor inputs. The framework matters less than the input quality.
Outside-in evidence produces specific inputs for feature prioritization that first-party analytics cannot produce. What shipped in the category tells you which features competitors validated. What regressed tells you which features they backed away from. What rivals removed tells you what strategic decisions they made. Cadence tells you how fast competitors can respond. Each of these inputs feeds a scoring framework as evidence about the competitive context of a feature decision.
A feature prioritization framework running on first-party analytics alone tells you about your own users' needs. The same framework running on first-party analytics plus outside-in evidence tells you about your users' needs contextualised against the competitive picture. Both approaches produce feature decisions; the second produces feature decisions with more of the picture accounted for. This holds whichever framework a team uses to structure the prioritisation conversation, which is fundamentally about deciding what evidence deserves weight rather than about the specific scoring mechanic.
This is not an argument for a specific framework. RICE works fine for teams who use RICE well. MoSCoW works fine for teams who use MoSCoW well. Weighted scoring works fine for teams who calibrate their weights well. The argument is about what inputs the framework runs on, and outside-in evidence produces inputs that make any framework produce better decisions than the framework running on first-party inputs alone.
Mobile app trends discussion in the wider industry can inform feature prioritization at the aggregate level. Reading what competitors actually shipped, regressed, removed, and how their cadence is running produces more granular signals that inform specific feature decisions rather than aggregate direction. For the aggregate direction alongside, app store trends via the Top 100 covers the top-level pattern reading methodology.
A Monthly Product Intelligence Ritual
Product intelligence is most useful when it becomes a regular practice rather than an ad-hoc research exercise. A monthly product intelligence review a PM can run consistently produces cumulative signal that catches patterns quarterly research misses and feeds regular planning cycles without becoming a burden.
The typical monthly ritual covers four steps.
Step one: identify the review set. Which competitors to review this month, plus any adjacent category leaders whose product decisions inform yours. Five to eight apps is a workable set for a monthly cadence. Larger sets become skimmable rather than thoughtful. Smaller sets miss category-level patterns.
Step two: run the four signal checks. For each app in the review set: what shipped since last review, what regressed if anything, what if anything was removed, and how cadence looks compared to prior months. Record the observations rather than the interpretations. Interpretation happens in step four.
Step three: check specific technology adoption or tech stack questions the team is currently considering. If the team is thinking about investing in a specific technology category or SDK, use the review to check whether competitors are moving in the same direction. If the team is considering deprecating a technology, check whether competitors are also moving away from it or whether the team's move would be atypical.
Step four: synthesise findings for planning. Turn the observations into planning inputs: patterns worth acting on, patterns worth watching, patterns to explicitly ignore. Feed the outputs into whatever product planning framework the team runs.
Most teams that adopt this ritual find the review takes an hour or two once the workflow is settled and produces genuinely useful signal for the following month's planning. The ritual becomes valuable at the third or fourth cycle when patterns start to emerge across months rather than showing only within a single month's snapshot.
A note on scale. The manual version of the ritual works at small competitor set sizes. Once the review set grows past ten or fifteen apps, or once the team is tracking an entire chart rather than a selected competitor set, manual store checks become the bottleneck and the ritual either stops being monthly or stops being thorough. This is where a tool like Appnalysis genuinely earns its place, because reading store surface and package-level evidence across a larger sample set is exactly the workflow it is built for. The larger the sample set a team wants to track, the more valuable the tool becomes, because the alternative is either dropping the discipline or spending more time on it than the outputs justify. Teams starting the ritual can begin manually to prove the value, then adopt tooling once the set size makes manual work impractical.
For teams wanting the deeper KPI framework to run alongside the outside-in review, the Coderus KPIs and metrics guide covers the specific KPIs and their formulas in depth. The Coderus guide covers installation, engagement, revenue, performance, marketing, and ASO KPIs across the mobile app lifecycle; running those KPIs on first-party analytics alongside the outside-in review gives a mobile product manager both sides of the product intelligence picture.
How Appnalysis Fits Into Product Intelligence
The aim is to do for mobile apps what Bloomberg did for financial markets: turn scattered evidence into one interrogable layer. Serious product intelligence work has needed an aggregated evidence layer for years, and the fragmented state of mobile market evidence has held the discipline back. Appnalysis is building that layer: aggregating outside-in signals that were previously scattered, giving analysts and product managers a workable interface to interrogate them, and making systematic product intelligence possible at speeds that manual research cannot match.
For the product intelligence use cases described throughout this article, two Appnalysis tiers matter.
App Store Intelligence covers the continuous outside-in evidence layer relevant to product planning: release cadence tracking across categories, version notes and change patterns, Data Safety and privacy declaration patterns, permission scope changes, review sentiment shifts, developer response behaviour, store standing changes. Most of the four signal types (what shipped, what regressed, what rivals removed, cadence) operate at this tier. The monthly ritual described in section 8 uses this tier as its primary evidence source.
App Intelligence covers the deeper package-level evidence that supports specific product intelligence questions: SDK inventory verification for tech stack analysis, subprocessor mapping from shipped SDKs, deep permission analysis, technology adoption tracking through SDK footprint patterns. The tech stack signals described in section 4 operate at this tier, as does the AR-adoption checking described in section 5.
For teams running mobile app competitor analysis alongside this product intelligence treatment, see Competitor App Analysis: A Practical Mobile Guide which covers the specific analysis workflow in depth.
For teams using AI-assisted research workflows (Claude Code, Cursor, or other agents with MCP configured), Appnalysis is available as a knowledge specialist that agents can query directly during product research work. See Your AI Coding Agent Only Sees Half the Picture for the MCP integration pattern.
Start Your Product Intelligence Work
The fastest way to evaluate outside-in product intelligence for your specific product planning work is to run one of the four signal checks on a specific competitor you care about. Bring one competitor and one specific question about them, and see what the evidence surface returns.
Frequently Asked Questions
Related Reading
- What is Mobile App Intelligence - the category definition pillar this article sits under
- Mobile Thought Leadership Research: What Changes When You Read the Apps - sibling article in the content-and-research cluster
- Mobile App Metrics for Training and Capability Planning - sibling article on metrics benchmarking for capability decisions
- Market Intelligence Tools for Mobile Apps - sibling article on the tools landscape
- Shadow IT Discovery for Mobile Apps - governance cluster piece on portfolio discovery
- Competitor App Analysis: A Practical Mobile Guide - the deeper competitor analysis methodology
- Your AI Coding Agent Only Sees Half the Picture - how Appnalysis works with AI-assisted workflows via MCP